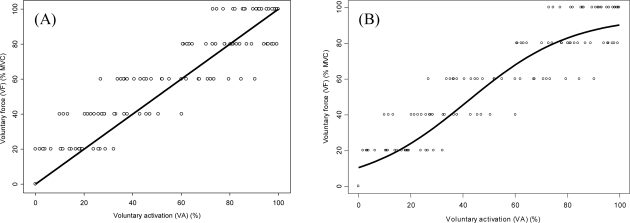
Figure 3.
The figure presents the conventional model (A) and the logistic growth model (B) overlaying on the true measured (circles). The conventional model showed a linear relationship between true voluntary contraction force (VF) and the VA. The logistic growth model suggested that VA has a sigmoid relationship with VF. The x axis for both plots is the VA calculated from the conventional model.

