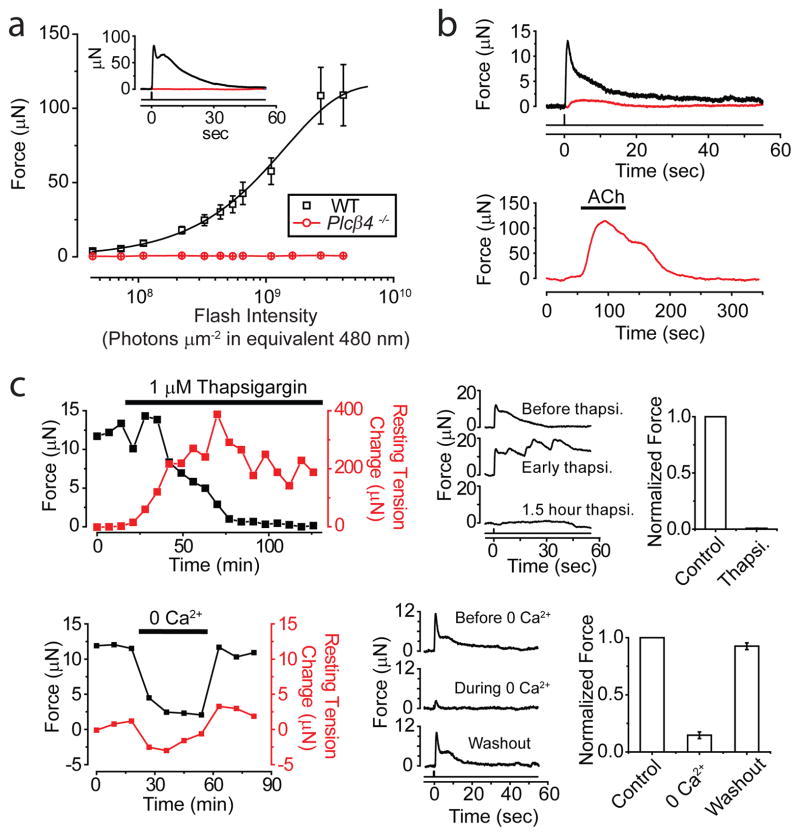
Figure 4.
Phototransduction mechanism underlying intrinsic PLR. a, Average flash intensity-response relation for Plcβ4−/− muscle (5 experiments). WT relation from Fig. 1c shown for comparison. Inset shows sample responses of WT and Plcβ4−/− to a saturating flash, at 4.0×10⁹ photons μm−2 (equivalent 480 nm). b, Top, Example of a Plcβ4−/− muscle (red) showing a tiny response (<3 μN) to first few dim flashes (7.3×10⁷ photons μm−2) before becoming unresponsive. WT response (black) to same dim stimulus also shown for comparison. Bottom, Same Plcβ4−/− muscle nonetheless responded substantially to 10-μM acetylcholine. c, Thapsigargin and removal of extracellular Ca2+, respectively, greatly diminished light response. Left, Time course of effect on peak force (black) generated by dim flashes (1.1×10⁸ photons μm−2). Resting muscle tension (red) arbitrarily set as 0 before thapsigargin or 0-Ca2+ application. Middle, Sample responses. Right, Collected data (4 muscles each). White Hg light for two brightest flashes in intensity-response relations of a; all other stimuli were 436-nm Hg light. All intensities expressed in equivalent 480 nm photons. Flashes delivered at time 0, as a 3-mm-diameter spot covering entire muscle. 35–37°C.

