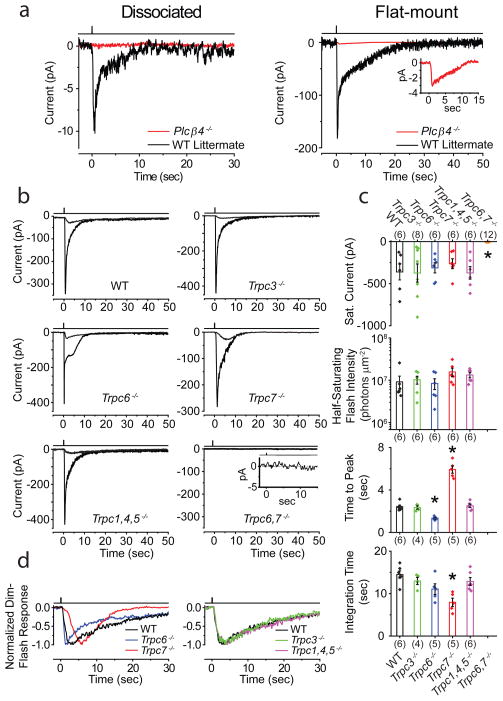
Figure 5.
Phototransduction mechanism and components underlying ipRGC intrinsic light response. Cells identified for electrical recordings based on Opn4:tdTomato reporter background in all mouse lines. 23°C. a, Left, Dissociated Plcβ4−/− ipRGCs showed no detectable response to a saturating white Xe flash. Average of 4 trials for each response. Right, In flat-mount retina after synaptic block, Plcβ4−/− ipRGCs showed a tiny residual response (magnified in inset) to similar saturating flash. Single flash trial for WT-littermate, and average of 5 trials for Plcβ4−/−, explaining the low baseline noise in latter. 50–100 ms flashes delivering 1.97 – 3.94 × 10⁹ photons μm−2 (equivalent 480 nm) in all cases. b, Intrinsic light responses from ipRGCs in flat-mount retina from WT, Trpc3−/−, Trpc6−/−, Trpc7−/−, Trpc1,4,5−/− and Trpc6,7−/− mice. Averaged responses to both dim (2.28–7.76×10⁵ photons μm−2) and saturating flashes (2.05×10⁸ photons μm−2) in each case are shown except Trpc6,7−/−, for which only response to brightest flash is shown (magnified in inset and essentially zero). Flashes were 100–300 ms of 505-nm LED light. c, Comparison of saturated response amplitude and dim-flash-response parameters from b. Half-saturating flash intensity (i.e., intensity eliciting a half-maximum response) is inversely proportional to sensitivity. Time-to-peak is the time lapse between flash and transient peak of dim-flash response. Integration time, ti, of the dim-flash response is a measure of its overall duration, given by ti = ∫ f(t)dt/fp, where f(t) is response profile and fp is its transient-peak amplitude. Collected data (mean ± SEM), where “*” indicates p<0.001 compared to WT by two-samples t-test. The number of cells examined for each parameter is in parentheses, and not always the same across parameters because not all parameters were obtainable for each cell. d, Normalized, averaged dim-flash responses from b for comparison of response waveforms. All intensities expressed in equivalent 480-nm photons, and delivered as a 730-μm-diameter spot centered on soma, sufficient for covering entire intact cell in retina. Light monitor above each trace. All recordings in perforated-patch, voltage-clamp mode (Vhold = −80 mV), with synaptic transmission blocked pharmacologically.

