Figure 4.
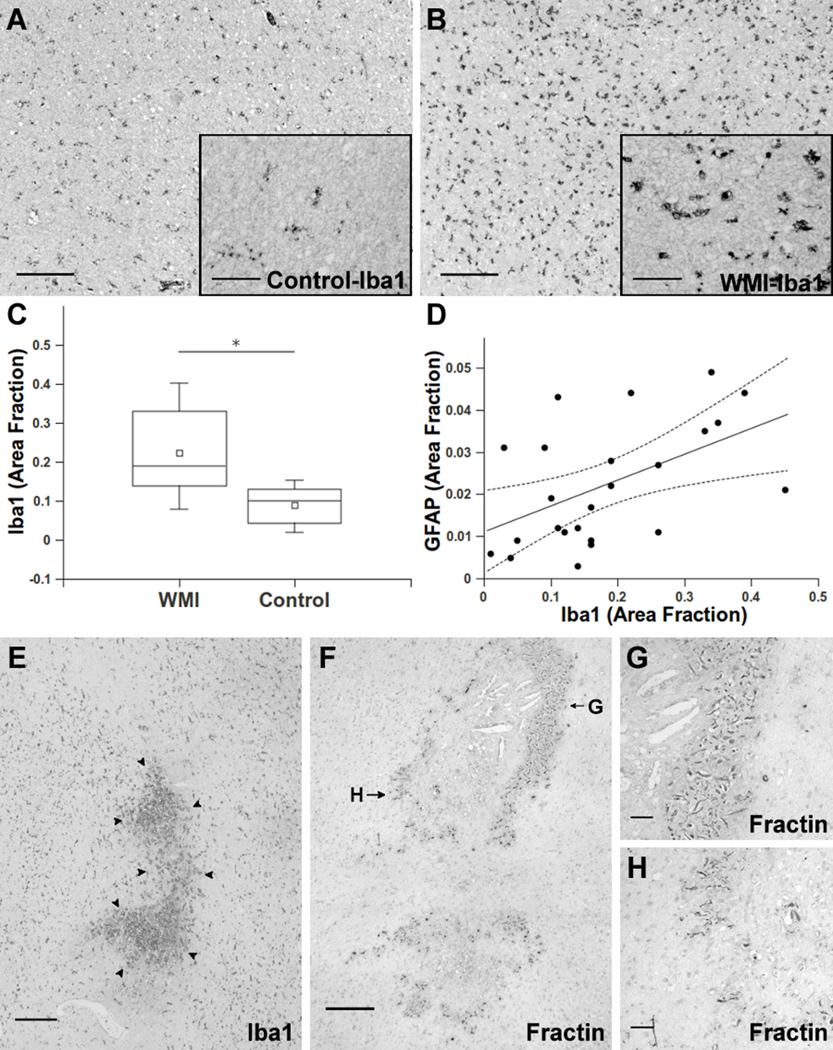
Microglia activation persists in chronic WMI lesions and identifies microcysts that coincide with focal axonopathy. (A, B) Typical appearance of resting microglia stained for Iba1 in controls (A) and ramified/ activated microglia in WMI lesions (B) from cases at 38 weeks PCA. Insets show higher power detail of the cells in A and B. (C) The total area of Iba1-labeled cells was significantly elevated (*p=0·01) in the retrospective WMI cases (Table 1) relative to controls. (D) Iba1 and GFAP were significantly associated (p=0·002) when analyzed across the entire cohort of control and WMI cases. Dashed lines are the 95% confidence intervals for the group analysis. (E) Typical appearance of a microscopic focus of necrosis (microcyst) in the periventricular white matter, which was first identified by H & E staining and confirmed by Iba1 staining of microglia/macrophages (arrowheads). (F) Axonal degeneration was restricted to microcysts as visualized with the Fractin antibody. Fractin staining was mainly localized to the periphery of the necrotic foci. (G, H) High power details of the degenerating axons in panel F show numerous swollen and dystrophic-appearing axons.
Scale bars: A, B, E, F, 250 µm; A and B insets, G, H, 50 µm.

