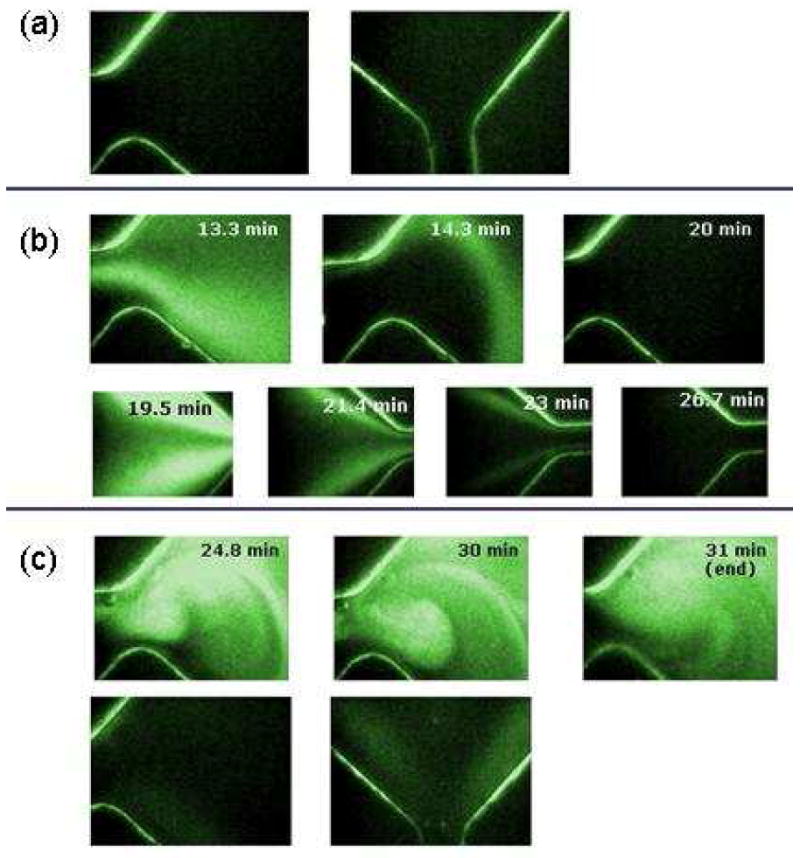
Figure 2.

Fluorescence images to demonstrate capture of oligonucleotides described in detail in the text. (a) Image of the cartridge prior to the experiment. (b) FAM-labeled oligonucleotide being electrophoresed through the capture chamber when filled with LPA. Top row is the entrance to the capture chamber from the sample chamber. The bottom row is the exit from the capture chamber to the waste reservior (c) Top row is the FAM-labeled oligonucleotide being retained in the capture chamber by the SK462 matrix. Bottom row is following the dehybridation at 75 °C and electrophoresing the oligonucleotide to the recovery well so that the fluorescence returns to background.
