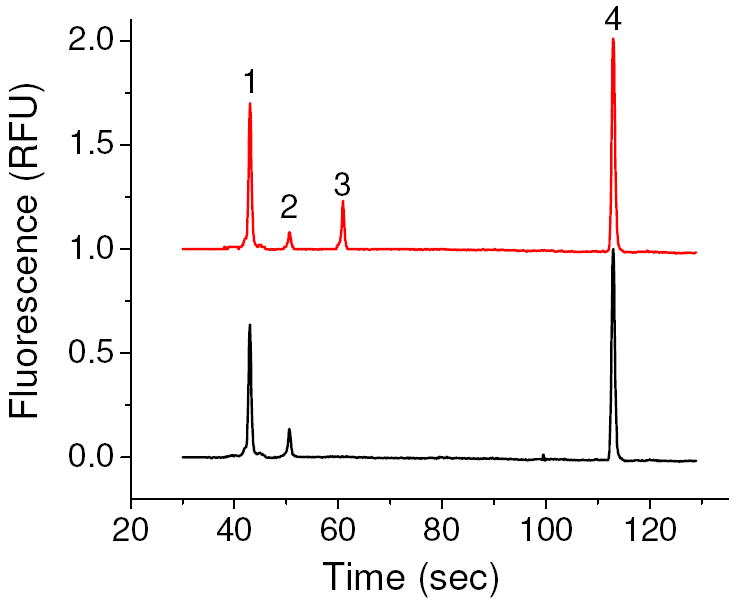
Figure 3.

Representative elctropherograms of PCR products of a sample containing the target (top) and a blank sample (bottom). Peaks 1 and 4 are the lower and upper DNA markers, respectively, peak 2 is a primer-dimer and peak 3 is the amplified target.
