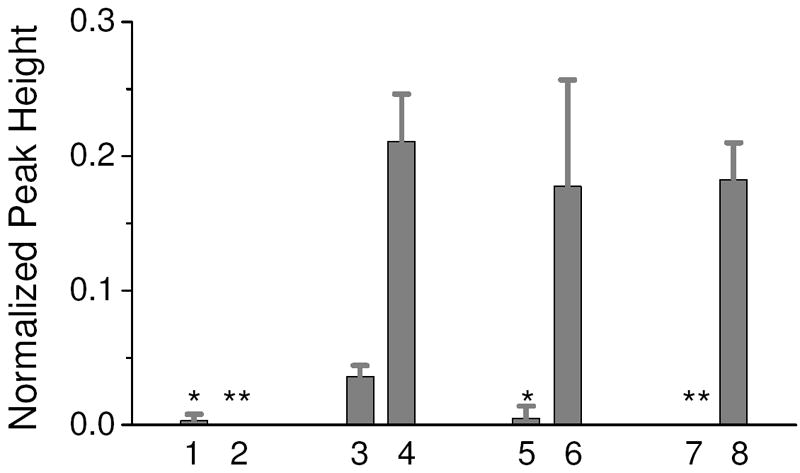
Figure 4.

Normalized peak height results of ssDNA purification experiments. Lane 1 is a 1 pg/μl in 0.1xTTE using the LPA matrix. Lane 2 is a blank sample using the SK462 capture matrix. Lanes 3 and 4 are 50 fg/μl and 1 pg/ μl, respectively, in 0.1xTTE using the SK462 capture matrix. Lane 5 and 6 are 1 pg/ μl in 0.1xTTE + 10 mg/ml hemoglobin unpurified and purified, respectively. Lane 7 and 8 are 1 pg/ μl in 10% serum unpurified and purified, respectively. n=3 for all lanes. One PCR amplification per purified sample or control sample was performed. * - amplification detected in one out of the three PCR reactions. ** - no amplification detected in any PCR reaction.
