FIGURE 3.
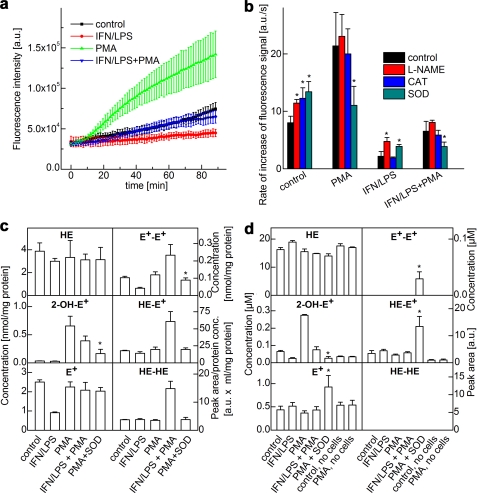
Real-time monitoring of products of HE oxidation by activated macrophages. a, increase in fluorescence was monitored in a fluorescence plate reader (excitation at 485 nm, emission at 595 nm) from incubations containing RAW 264.7 macrophages activated by different stimulators as shown. a.u., arbitrary units. b, rate of increase in the fluorescence signal intensity from RAW 264.7 macrophages activated by different stimulators in the presence of l-NAME and ROS-detoxifying enzymes. CAT, catalase; SOD, superoxide dismutase. c, same as b except that HE-derived products in cell lysates were analyzed by HPLC after a 1-h incubation. d, same as c except that HE products were detected by HPLC in the media. *, p < 0.05.

