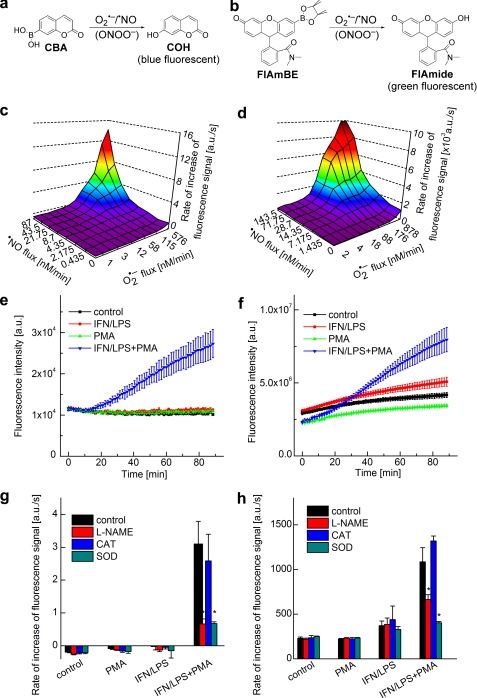
FIGURE 4.
Measurement of ONOO− formation by monitoring oxidation of boronate-based fluorogenic probes. a, scheme showing oxidation of CBA to 7-hydroxycoumarin (COH) (blue fluorescence) by •NO and O2˙̄. b, scheme showing oxidation of FlAmBE to the green fluorescent product, fluorescein N,N-dimethylamide (FlAmide), by •NO and O2˙̄. c, blue fluorescence (excitation at 320 nm, emission at 440 nm) was monitored in a plate reader from incubations containing CBA (20 μm) in phosphate buffer in the presence of varying fluxes of •NO and O2˙̄. a.u., arbitrary units. d, green fluorescence (excitation at 485 nm, emission at 535 nm) was monitored from incubations containing FlAmBE (20 μm) in phosphate buffer and varying fluxes of •NO and O2˙̄. e, increase in the blue fluorescence intensity was monitored using a plate reader, derived from RAW 264.7 macrophages in DPBS-GP buffer containing CBA (20 μM) and different stimulators. f, increase in green fluorescence intensity was monitored using a plate reader from incubations containing RAW 264.7 macrophages and FlAmBE (20μM) in the presence of different stimulators. g, same as e but in the presence of l-NAME and ROS (O2˙̄ and H2O2)-detoxifying enzymes. h, same as f but in the presence of l-NAME and ROS (O2˙̄ and H2O2)-detoxifying enzymes. *, p < 0.05.

