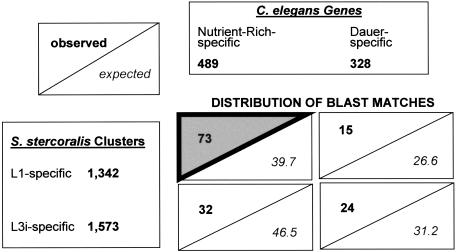
Figure 4.
Data sets of S. stercoralis L1-specific and L3i-specific clusters (lower left) were used to search sets of C. elegans nutrient-rich-specific and dauer-specific clusters (top right) at 1e-30, resulting in 144 BLAST matches distributed in four quadrants (lower right). Each quadrant shows the number of observed matches and expected matches, based upon the null hypothesis that the distribution of matches would reflect the relative sizes of the input data sets. Matches were found to be concentrated in the L1/nutrient-rich quadrant (gray triangle). Although individual S. stercoralis clusters may lack adequate sample size to be considered significantly biased in their expression alone, the full set of L1- and L3i-specific clusters including singletons can be used in this comparison, as the collection as a whole is significantly biased. Restriction of the L1 and L3i sets to clusters with significant L1- and L3i-biased expression shows the same type of distribution, with a concentration in the L1/nutrient-rich quadrant.

