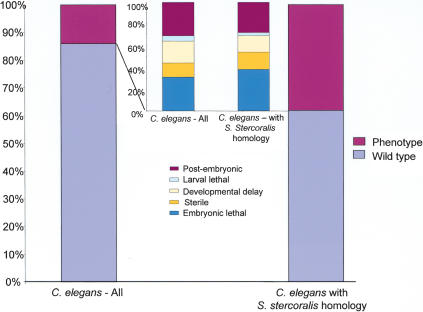
Figure 5.
A comparison of phenotype distribution between all RNAi-surveyed C. elegans genes (left) vs. only those genes with homology to S. stercoralis (right). Large columns display percent with and without phenotype. Small columns display percent breakdown of various phenotypes observed. C. elegans genes with S. stercoralis homologs are significantly more likely to have pheno-types by RNAi.

