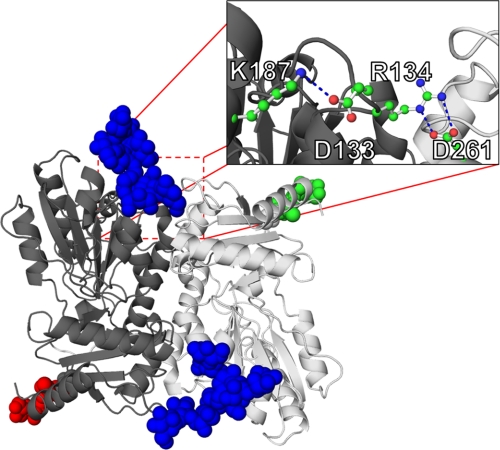
FIGURE 9.
Structural impact of K206N mutation. Shown is a hypothetical model of glycan positioning in K206N mutation. Normal glycosylation moieties positioned at Asp-316 are shown in green and red for each monomer, and expected glycosylation moieties introduced by mutation at K206N are shown in blue. The inset represents the salt bridge that stabilizes the front-to-front interface.

