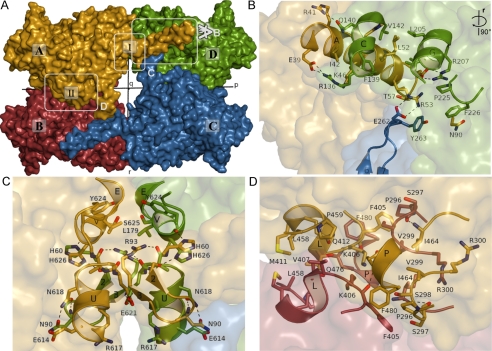
FIGURE 2.
Tetramer interactions of TgNTPDase3. Chains A, B, C, and D of the protein structure are colored in yellow, red, blue, and green, respectively. A, surface representation with the 2-fold symmetry axes p, q, and r (see “Results and Discussion”). Interfaces I and II are indicated. B–D, zoom of different areas of the tetramer interfaces. Interacting residues are shown as sticks and labeled with the residue number. Polar interactions are indicated by dashed lines. B and C, interactions at interface I. For a better view, the molecules in B were rotated 90° around the r axis. D, interface II between chains A and B.

