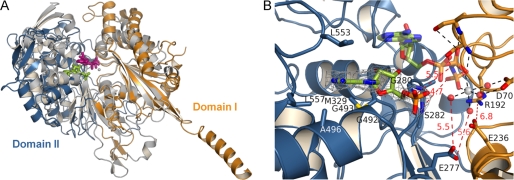
FIGURE 3.
Comparison of TgNTPDase3 to the mammalian cell surface NTPDase2. A, superposition of RnNTPDase2 (gray; bound Ca2+-AMPPNP gray/violet) and TgNTPDase3 (orange/blue; bound AMP green). Residues 45–58 and 115–127 for domain I of RnNTPDase2 were aligned with corresponding residues 70–83 and 181–193 of TgNTPDase3. B, close-up view of the active site. An omit electron density map (Fo − Fc × ϕc, contoured at 3 σ) of AMP is shown in gray. Active site ligands from the superimposed RnNTPDase2 structure are shown with half-transparency. Amino acids involved in binding of the base and residues expected to interact with the phosphate groups of ATP or ADP are indicated. A selection of polar interactions that occur in the productive substrate binding mode of RnNTPDase2 are shown as dashed lines and drawn red when distances are too long for the formation of hydrogen bonding or salt bridge interaction. The figure illustrates that domain II that binds the nucleoside moiety has to rotate toward domain I for the formation of a productive substrate binding mode.

