FIGURE 5.
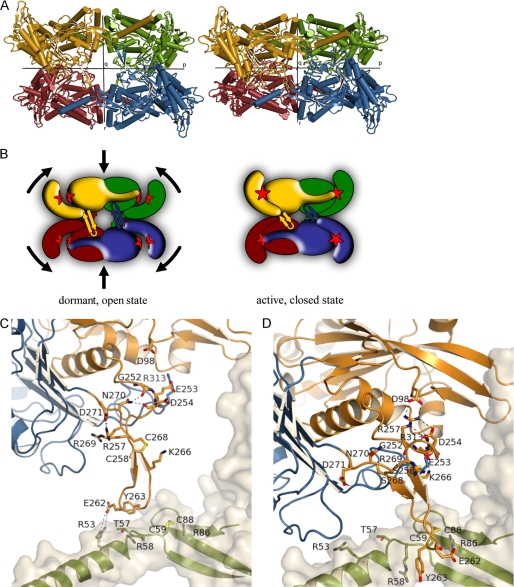
Structural changes upon enzyme activation (see also supplemental Movie S1). A, tetrameric structures of TgNTPDase3 (left) and TgNTPDase3ΔCC (right). The chains are colored as in Fig. 2. B, schematic representation of the conformational switch shown in A after reduction of Cys258-Cys268, which is located in the β-sheet between the monomers. Reduction of the activation loop (β-hairpin) results in tetramer contraction, domain closure, and establishment of the correct active site (red star) geometry. C and D, conformational change and interactions of the activation loop. Shown is the loop of monomer A in the same orientation as in A. Domains I and II are colored in orange and blue, respectively. The schematic and sticks of the neighboring subunit are colored in green with a light gray protein surface. Shown are all residues involved in interactions either in the open/inactive form (C) or in the closed/activated conformation (D). The hydroxyl groups of Ser258 and Ser268 in the crystal structure of TgNTPDase3ΔCC (D) are colored yellow to indicate the positions of the free cysteines in the reduced activated enzyme.

