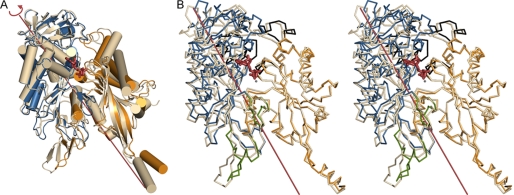
FIGURE 6.
Domain motion upon enzyme activation: comparison between TgNTPDase3 (chain C (light gray)) and TgNTPDase3ΔCC (chain B, domain I (orange) and domain II (blue)). A, superposition of the structures based on domain II. AMPPNP (red) marks the position of the active site. B, stereo view of Dyndom assignment of the dynamic domains. The interdomain screw axis (12° rotation, 0.03 Å translation) and AMPPNP are shown in red. The structures are superimposed based on domain I. Residues assigned to neither of the two domains are colored in green. Regions undergoing significant internal displacements are colored in black.

