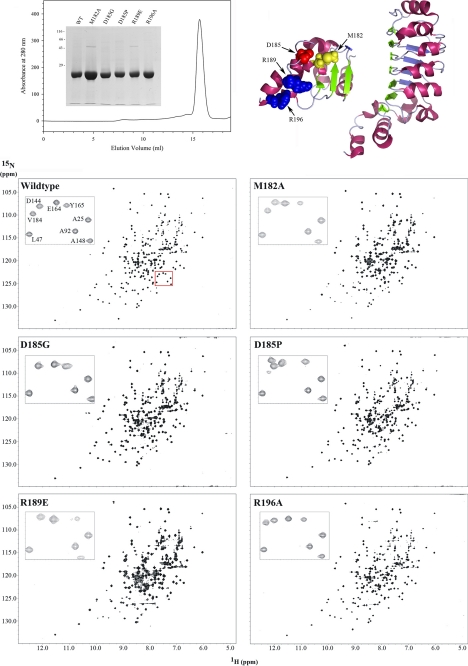
FIGURE 2.
1H-15N HSQC spectra for wild-type and C-terminal mutant forms of LC1. The ribbon structure of LC1 and location of the four mutated residues within the C-terminal domain are shown at the top right. The final gel filtration profile of a representative 15N-labeled LC1 protein sample (R196A) is at the top left; inset, electrophoretic analysis of 15N-labeled LC1 proteins (12.5% SDS-polyacrylamide gel; Coomassie Blue stain). The two-dimensional 1H-15N HSQC spectra for wild-type and the M182A, D185G, D185P, R189E, and R196A mutant forms of LC1 are shown in the lower panels. Each peak represents an amide resonance derived from the peptide backbone, Asn/Gln side chains, or the Trp indole ring. All spectra reveal a similarly high degree of peak dispersion in both 1H and 15N dimensions, suggesting that the mutant proteins are well folded as is wild-type LC1. The insets show an enlargement of a small region (red box in wild-type spectrum) to illustrate the high resolution achieved for all LC1 proteins using the 800-MHz spectrometer.

