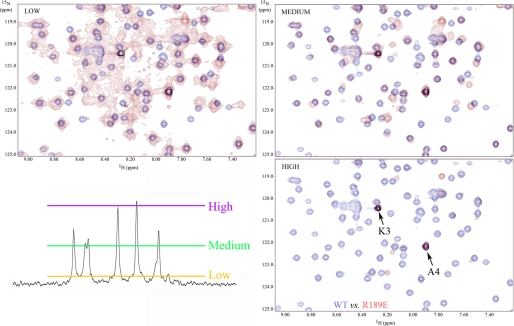
FIGURE 3.
R189E mutation causes extensive peak broadening. The central region of the 1H-15N HSQC spectrum for wild-type LC1 (blue) was superimposed on the equivalent region for R189E LC1 (red) drawn at three different contour levels. The approximate locations of these contour levels are illustrated on a representative vertical slice through the R189E spectrum at the bottom left. Many peaks are not well resolved for the mutant protein at a low contour and are missing from the spectrum at higher contours. In contrast, wild-type peaks are well resolved. The two very strong peaks present in the high contour map of R189E LC1 represent residues Lys3 and Ala4 that are very close to the N terminus and exhibit high mobility (low order parameter) (17). These observations suggest that R189E LC1 transitions between structural states on the μs to ms time scale.

