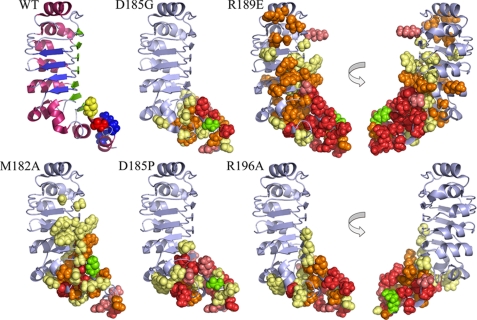
FIGURE 4.
Chemical shift mapping of perturbations within mutant LC1 proteins. The wild-type LC1 structure and mutated residues are illustrated at the top left: yellow, Met182; red, Asp185; blue, Arg189 and Arg196. The locations of chemical shift alterations (Δδ) determined for the five mutant forms are shown in the other panels (two views of the R189E and R196A changes rotated by 180° around the y axis are illustrated). The side-chain atoms of residues that showed significant chemical shift (δ) perturbations compared with wild-type are represented as spheres. The color code is as follows: Δδ (in 1H and/or 15N dimension) ≤0.1 ppm, pale yellow; ≤0.2 ppm, orange; ≤0.3 ppm, deep salmon; >0.3 ppm or missing/unidentified, red; the mutated residue is indicated in green.

