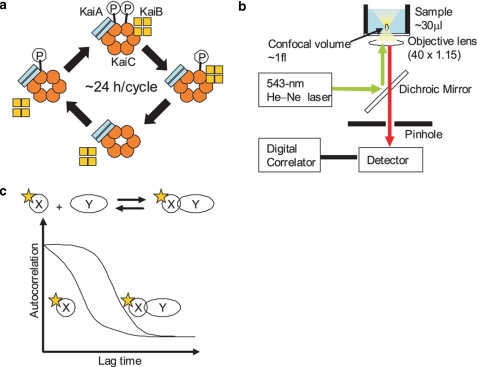
FIGURE 1.
Schematic of the FCS method to assess dynamic protein-protein interactions in the Kai oscillatory system. a, cyclic Kai complex formation in the cyanobacterial circadian system composed of KaiA, KaiB, and KaiC. During the phosphorylation phase, the KaiC complex includes only KaiA, whereas, during the dephosphorylation phase, the KaiC complex includes both KaiA and KaiB. b, a fluorescence correlation spectrometer unit in the MF20 single-molecule fluorescence detection system (Olympus). A 543 nm He-Ne laser is directed through an objective lens and used to excite a fluorescently labeled protein. Fluorescence from a small focal volume (∼1 fl) is detected through a pinhole, and the signal is processed using a digital correlator. c, a schematic diagram of the fluorescence correlation change associated with binding of a labeled protein. Fluctuations in the fluorescent signal are analyzed via an autocorrelation function, and the diffusion time is calculated. The correlation curve shows a rightward shift as the labeled molecule becomes larger, and the diffusion time of the bound form of a fluorescently labeled protein (XY) is longer than that of the free form (X).

