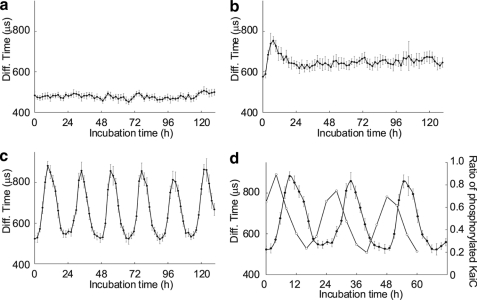
FIGURE 3.
Monitoring circadian rhythms in the Kai protein oscillatory solution using FCS. Diffusion times over a 5-day period obtained with FCS and TAMRA-KaiB-His6 and 3.5 μm KaiB (a), 3.5 μm KaiB and 3.5 μm KaiC (b), or 1.2 μm KaiA, 3.5 μm KaiB, and 3.5 μm KaiC (the standard mixture) (c). d, oscillations of the diffusion time and KaiC phosphorylation in the standard mixture are shown. Filled and open circles represent diffusion times and KaiC phosphorylation ratios, respectively. FCS analysis of Kai protein mixtures containing TAMRA-KaiB-His6 was performed every 2 h. A representative example of two or more FCS independent experiments is shown. Each data point represents the mean ± S.D. from 10 measurements at the indicated time point.

