FIGURE 4.
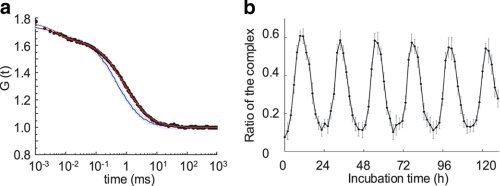
Estimation of the KaiC-bound fraction of the probe using a two-component analytic model of FCS. a, typical autocorrelation curves obtained after 9.4 h of incubation with samples containing TAMRA-KaiB-His6 and KaiB (Fig. 3a) or the standard Kai protein mixture (Fig. 3c) are indicated using open and filled circles, respectively. The autocorrelation function of TAMRA-KaiB-His6 mixed with only KaiB was fit with a one-component analytic model, and the diffusion time was estimated to be 482.5 ± 16.6 μs (blue fitting curve). The autocorrelation function of TAMRA-KaiB-His6 in the standard mixture was fit with a two-component analytic model by fixing the diffusion time of the free fraction at 482.5 μs (red fitting curve). b, circadian oscillation of the ratios of KaiB-bound KaiC complex. Ratios of the complex were computed using the same data set in Fig. 3c.

