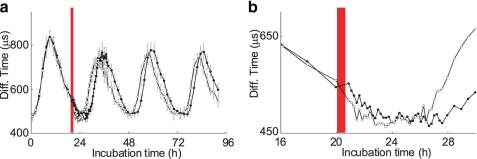
FIGURE 6.
Changes in Kai complex formation in response to a high temperature pulse. a, changes in the diffusion time in response to a high temperature stimulus after 20 h of incubation. Intervals between data points were ∼2 h for the first 20 h and last 52 h of the 92-h incubation period, 10 min between 20 h and 27 h of the incubation period, and 30 min between 27 h and 40 h of the incubation period. Open and filled circles in each plot represent diffusion times in mixtures with and without the high temperature stimulus, respectively. Red bars indicate the duration of the pulse. Each data point represents the mean ± S.D. from 10 measurements at the indicated time point. b, a magnified plot of a for data around incubation for 22 h.

