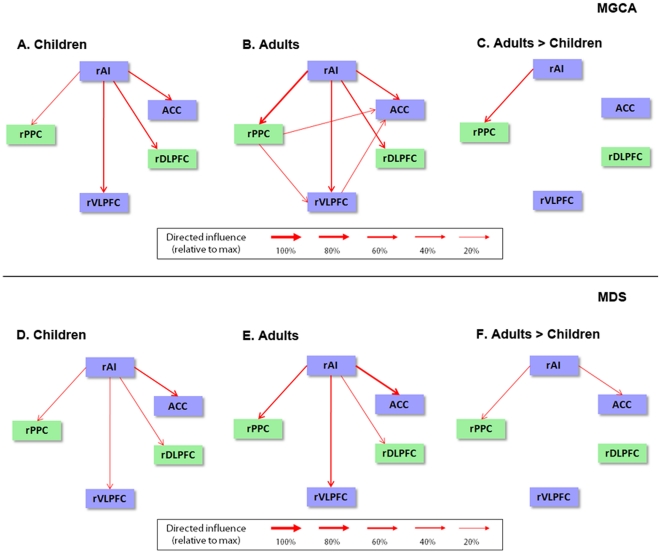
Figure 4. Developmental changes in causal network interactions during problem solving.
Top row . Multivariate Granger Causal Analysis (MGCA) of the five key nodes of the Salience network (blue rectangles), and Central Executive network (green rectangles) are shown in (A) Children and (B) Adults. (C) Weaker causal interactions in Children, compared to Adults. Bottom row . Converging evidence from a state-space Multivariate Dynamical Systems (MDS) model [34].

