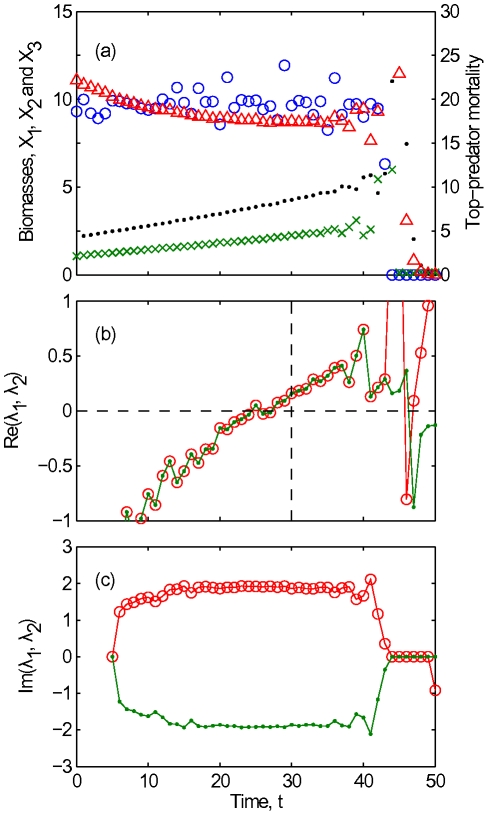
Figure 4. Early warning signal for a critical transition in a tri-trophic food chain.
(a) Time series of  (blue circles, left axis),
  (green crosses, left axis) and
  (red triangles, left axis) generated by the simulation model described in Text S1. Only the data subsequently used in the early warning analysis were plotted. Some of the data during the oscillations between
  and
and  were outside the scale of this graph, with
  exceeding 30. The estimates of top-predator mortality used to calculate the early warning signal are also shown (black dots, right axis). Parameters were
  ,
,  ,
,  ,
,  ,
,  ,
,  ,
,  and
and  . (b,c) Real and imaginary parts of eigenvalues estimated from the data in (a), using the procedure described in the text. Eigenvalues are denoted by dots and circles; a dot within a circle indicates two eigenvalues had the same real value. The markers and colors used in (b,c) have no correspondence to those used in (a). A third (purely real) eigenvalue was not plotted, for reasons described in the main text. In (b), the horizontal dashed line indicates the stability boundary at zero real part, while the vertical dashed line indicates the time that the (Hopf) bifurcation occurred in the fast subsystem of the simulation model.

