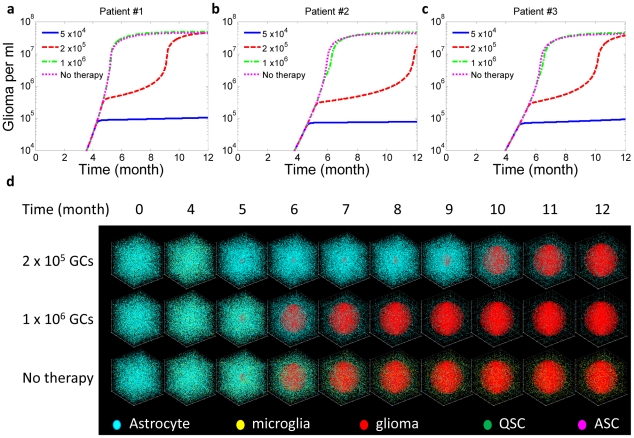
Figure 3. Microglia depletion therapy.
This therapy was given to three randomly designed virtual patients (Supporting Table S5) and administered at different stages corresponding to glioma cell (GC) concentration ∼5×10⁴/ml, 2×10⁵/ml, and 1×10⁶/ml, respectively. (a) Response of patient 1 to therapies given at different stages. (b) Response of patient 2 to therapies given at different stages. (c) Response of patient 3 to therapies given at different stages. (d) Snapshots of a 3D simulation showing the evolution of tumor microenvironment in patient 1 in response to microglia depletion therapy. Supporting Video S2 shows the full video.

