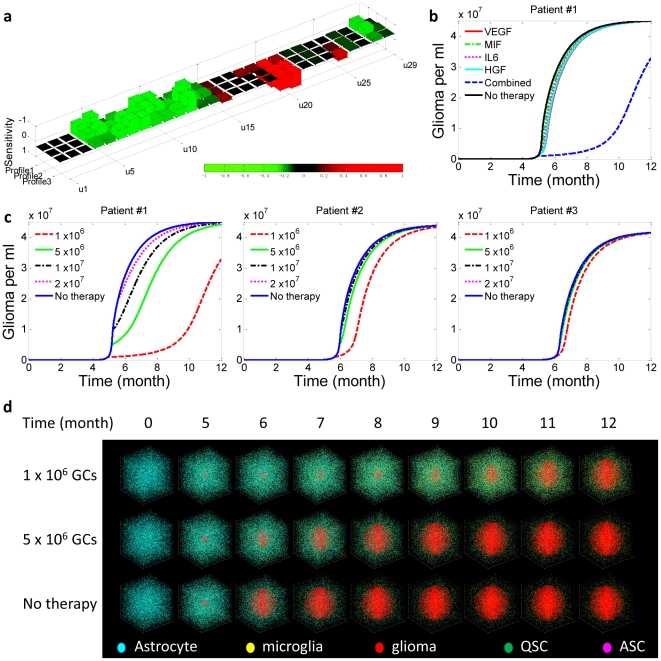
Figure 4. Cytokine combination therapy.
This was given to the same three virtual patients (Supporting Table S5) and administered at different stages, corresponding to glioma cell (GC) concentration ∼1×10⁶/ml, 5×10⁶/ml, 1×10⁷/ml, and 2×10⁷/ml, respectively. (a) Sensitivity analyses reveal the pro-tumorigenic potential of each cytokine in the examined tumor microenvironment. Supporting Table S7 summarizes all the parameters (u1–u29), surface receptor expression level. (b) Comparison of therapeutic efficacy between single-target and combination therapies. The combination therapy results in a striking synergistic effect to suppress tumor progression whereas any single target treatment does not show appreciable benefit. (c) Reponses of three patients to the same combination therapy, which is tailored to give optimum response for patient 1 based upon sensitivity analysis. (d) Snapshots showing tumor development in patient 1 with or without combination therapy. The therapy is give at a single dose when the glioma cell density reaches 1×10⁶/ml or 5×10⁶/ml. Supporting Video S3 is the complete video showing the one-year evolution.

