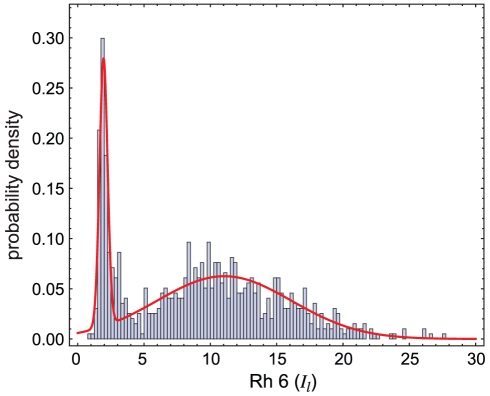
Figure 5. Bimodal expression of Rh6 in R8 cells.
The distribution of Rh6 levels in R8 cells shown here represents retinae at all time points. The bar graph indicates the probability density of all PRs in each expression level bin. A bimodal distribution, given by a mixture of two normal distributions, was fit to the data using maximum likelihood fitting. The means (μ) and standard deviations (σ) of the two Gaussians are shown, and the mixture proportion is such that 80% of cells express Rh6 at high levels, while 20% express Rh6 at low levels.

