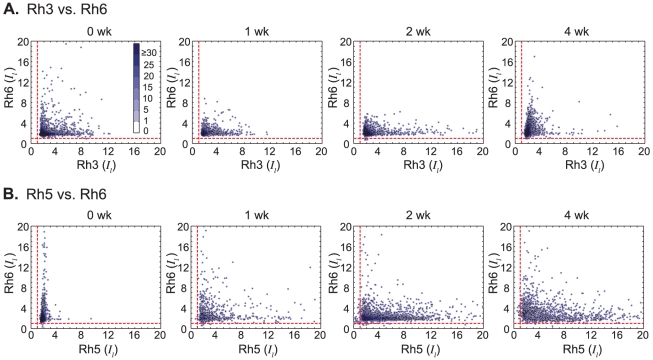
Figure 8. Distribution of pairwise Rhodopsin expression.
(A & B) Each point corresponds to a single PR, with the two coordinates giving the relative expression levels of two Rhodopsins. Data was pooled across all replicates at each time point. To give a sense for the density of points in different regions, each point was colored to indicate the number of points within a radius = 0.5 around it. The color bar shows the number of points indicated by each color.

