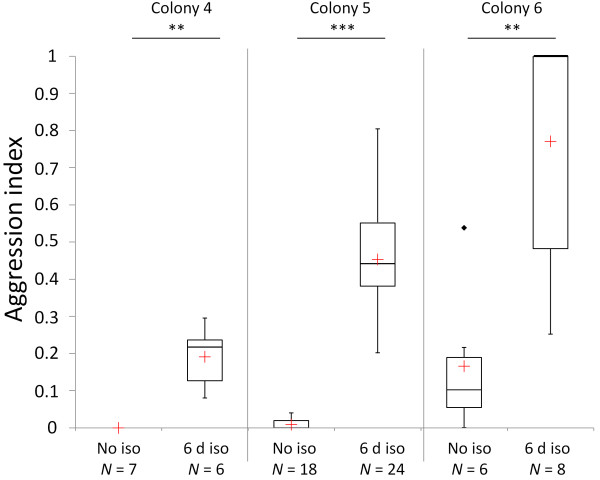
Figure 4.
Host aggression in three different colonies toward non-isolated silverfish and silverfish that were isolated for six days. Differences between groups were evaluated by PERMANOVA (**P < 0.01, ***P < 0.001). Median (red cross = mean), quartiles (boxes), 10th and 90th percentiles (whiskers), and outliers (black square = outlier) are shown. Abbreviations: No iso = no isolation, d iso = days isolated.

