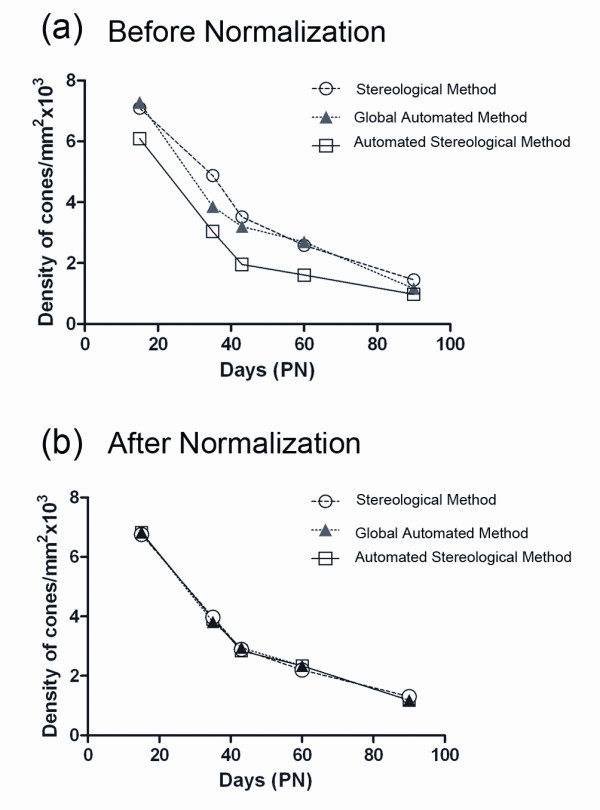
Figure 4.

Comparison of the three methods of counting. (a) Average cone density before normalization for the three methods used (stereological, global automated and automated stereological method). A two-way ANOVA with one factor representing days and the second factor the method, shows a difference with a p-value equal to 6.42 109. (b) Average cone density after normalization for the three methods used. The normalization involved use of the quantile-quantile method so that the quantiles of the set of measures obtained by each technique are equal. This normalization revealed a p-value of 1 indicating the absence of difference between the three methods.
