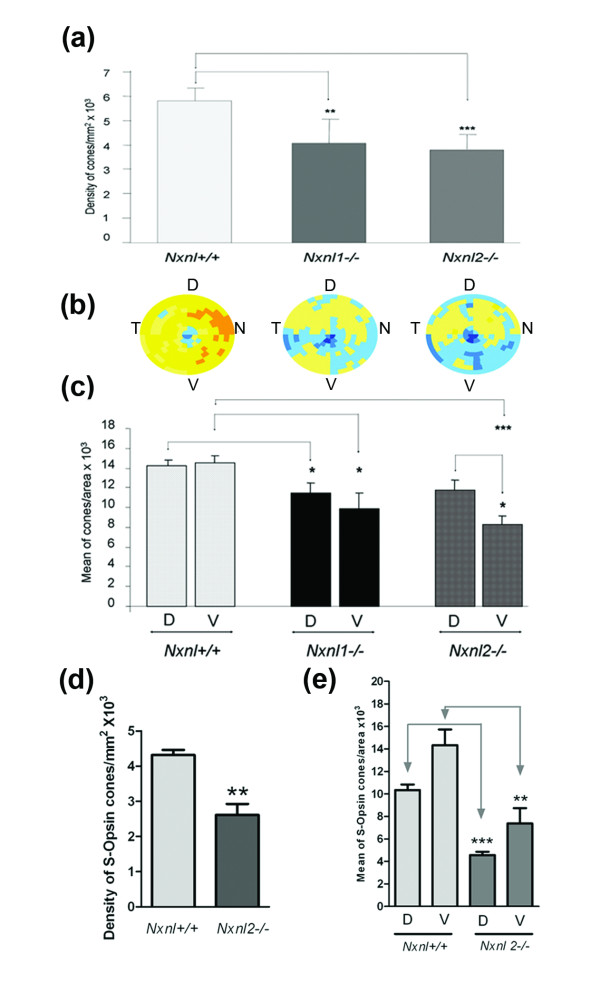
Figure 7.
Loss of cones in the Nxnl1-/- and Nxnl2-/- retinas its regionalization. (a) Global automated counting of cones of Nxnl1-/- and Nxnl2-/- versus Nxnl+/+ at PN8 months, (n = 7, 8, 10 respectively). Error bars show +/- SEM, * p < 0.05, ** p < 0.01, *** p < 0.001. (b) Visualization using virtual eye fundus of the cone density for the three genotypes. The density of cones in each segment is encoded by a color scale. Excluded areas are represented by a grey color and the absolute cone density value from dark blue, yellow to dark red are: 45, 90, 135, 180, 225, 270, 315, 360 and 405 cones/surface unit. (c) Regionalization of the cone density in the ventral versus the dorsal region of the retina. The surface of the regions (2.48 mm2) represents 22% of the retina. Error bars show +/- SEM, * p < 0.05, ** p < 0.01, *** p < 0.001. (d) S-cone density on the Nxnl+/+ and Nxnl2-/- retinas. (e) Regionalization of the S-cone density in the ventral versus the dorsal region of the Nxnl+/+ and Nxnl2-/- retinas.

