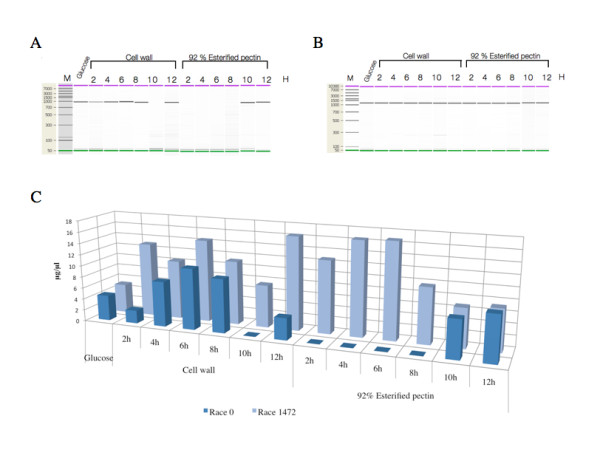
Figure 7.

Analysis of the relative gene expression of Clpnl2 in races 0 and 1472 of C. lindemuthianum. A-B. Gel-like images showing the expression of Clpnl2 in races 0 and 1472, respectively, on the different carbon sources tested. C. Semi-quantitative data for the expression of Clpnl2 in both races on the carbon sources. Total RNA was isolated from induced mycelia and amplified by RT-PCR with specific primers to yield the cDNA of Clpnl2. Amplification products were checked and quantified on a Bioanalyzer (2100 Agilent Bioanalyzer). The data were normalized using 18S rRNA as a control, and the results are expressed in μg/μl of amplified product.
