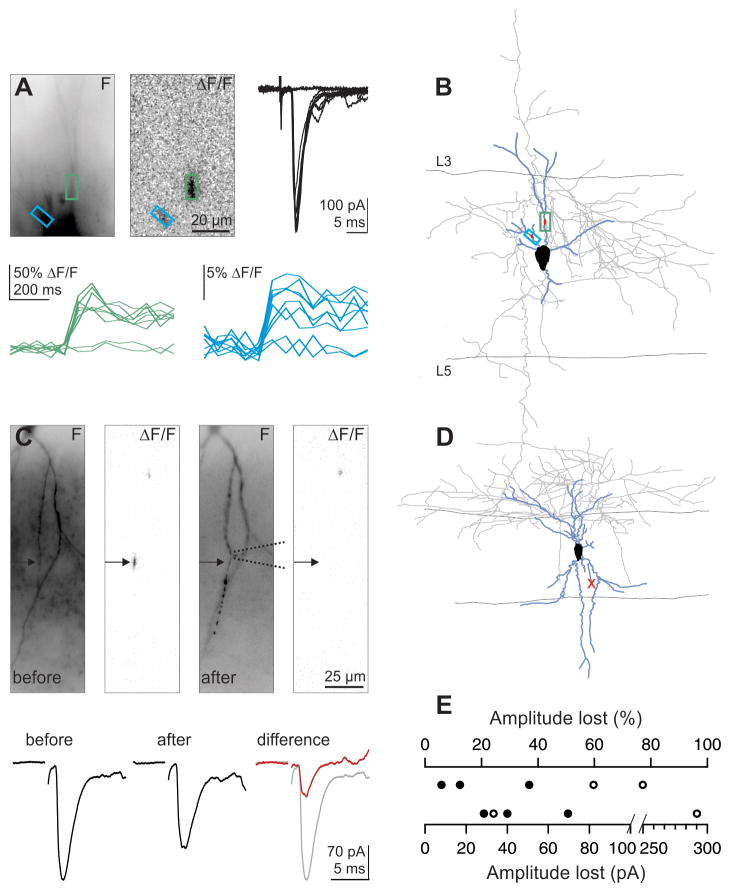
Figure 3. Individual thalamic axons can evoke multiple Ca hotspots.
(A) Threshold single fiber stimulation. (Top) Fluorescence image of recorded interneuron (left), ΔF/F image (average of 7 trials; center) and synaptic currents (7 successes and 2 failures; right) (Bottom) Successes and failures of Ca transients recorded in the color coded region of interest illustrated above. Successes and failures of the two Ca transients co-fluctuate with the successes and failures of the uEPSC.
(B) Reconstructed interneuron (blue, dendrites; gray, axon) from experiment in A with color coded regions of interest.
(C) Single fiber stimulation (Top) Fluorescence image of recorded interneuron (left), ΔF/F image (average of 6 trials; second image), and fluorescence image (third image) and ΔF/F (right image, average of 7 trials) after aspiration of dendrite (the dotted lines symbolize the position of the aspiration pipette). (Bottom) Average synaptic response before (left, average of 6 trials) and after (right; average of 7 trials) aspiration of dendrite. (Right) The difference between the synaptic response before and after dendritic aspiration (red trace) is superimposed on the average trace before aspiration (gray trace).
(D) Reconstructed interneuron (blue, dendrites; gray, axon) from experiment in A. The red × marks the aspirated dendrite.
(E) Summary of 5 similar experiments. Closed circles represent experiments in which the dendrite was severed by aspiration; open symbols indicate those in which the dendrite was severely bent and the Ca hotspot disappeared.

