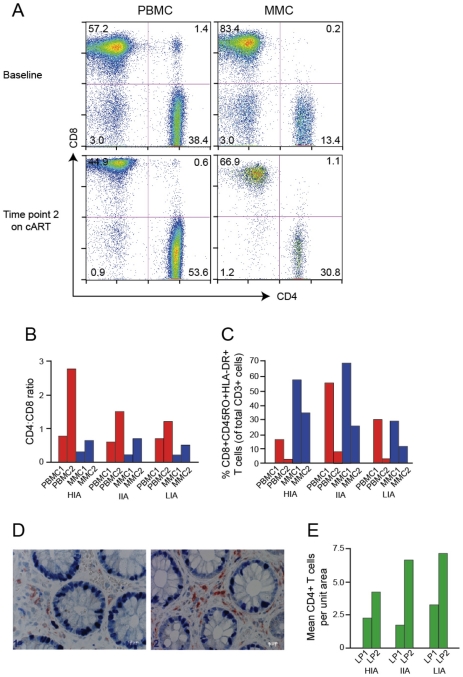
Figure 1. Immunological profiles of experimental patients before and after initiation of cART.
(A) Representative flow plots from low immune activator patient (LIA) are depicted. CD8+ T cells are shown on the x-axis and CD4+ T cells on the y-axis. (B, C) Bar graphs depicting CD4∶CD8 ratio (B) and levels of immune activation (C) of PBMC (red bars) and MMC (blue bars) before (PBMC1 and MMC1) and after (PBMC2 and MMC2) initiation of antiretroviral therapy. High immune activator (HIA), intermediate immune activator (IIA) and low immune activator (LIA) are compared. (D, E) Immunohistochemical characterization of immune effector sites in rectosigmoid biopsies. Using a PC-based image-analysis system (KS 4000, Kontron) a standard area was set by the image analyzer. A total of between 10 and 15 consecutive non-overlapping fields were analyzed. In figure (D), a biopsy section (viewed at 40× magnification) compares CD4+ T cells (stained red) of subject IIA before (left panel) and after (right panel) initiation of antiretroviral therapy. Figure (E) depicts mean CD4+ T before (LP1) and after (LP2) initiation of antiretroviral therapy. HIA, IIA and LIA are compared.

