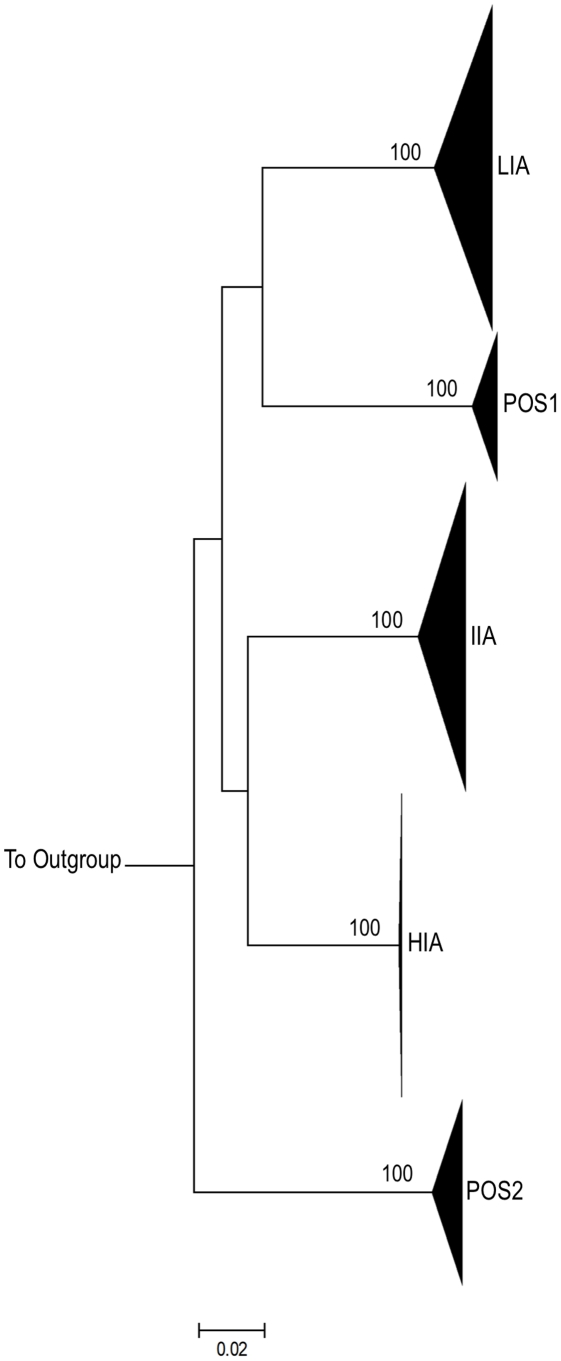
Figure 2. Intra-Patient clustering of HIV-1 env quasi-species.
Maximum Likelihood (ML) tree depicting full-length HIV-1 env sequences from three experimental subjects (HIA, IIA, LIA) and 2 positive control subjects (POS1 and POS2). For each subject, all sequences from both time-points (baseline and on treatment) and from all compartments described are shown. Bootstrap values (>95%) are shown for inter-subject clusters. 1000 bootstrap replicates were run and Bootstrap values over 85% are shown. The horizontal scale bar represents 2.0% genetic distance. Each subject forms a tight cluster and is distinct from other experimental subjects or controls. HXB2 was used as an outgroup.

