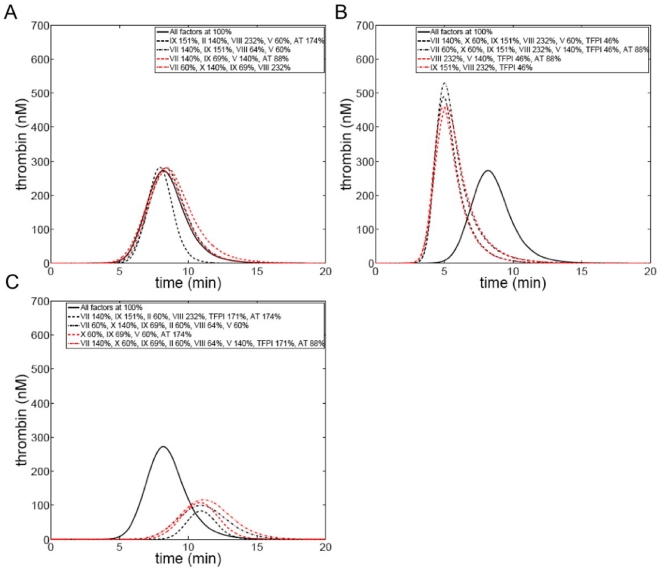
Figure 2. Thrombin generation time courses from selected individuals from an hypothetical population defined by normal range variation in factors.
Individuals were selected with disparate factor composition, but similar thrombin generation profiles and compared to an individual (control) with all factor levels at their mean physiologic value. Insets detail factor composition (as percentage of mean physiologic) which is variable among these individuals, with all other factors that are not listed at mean physiologic values. Panel A: 4 individuals similar to the control profile; Panel B: 4 individuals with accelerated and more robust thrombin generation relative to the control; and Panel C: 4 individuals with suppressed and delayed thrombin generation relative to the control.

