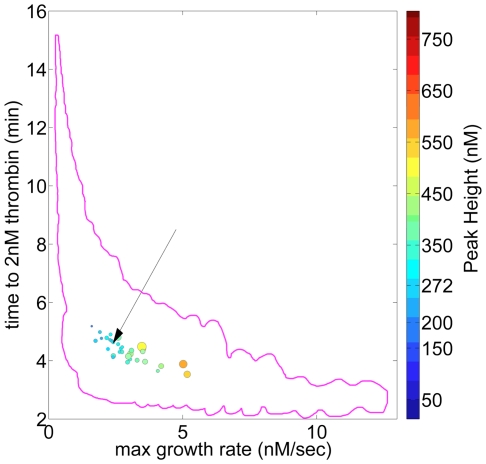
Figure 4. Thrombin generation phenotypes in a population of apparently healthy individuals.
Plasma factor composition for 32 individuals was used to generate time courses of thrombin generation, thrombin parameters were extracted and each individual represented as described in the legend to Figure 3. The boundaries (magenta) of the theoretical population are outlined and an individual with all factors at their mean physiologic values is also presented. Arroe indicates an individual with all factors at mean physiological.

