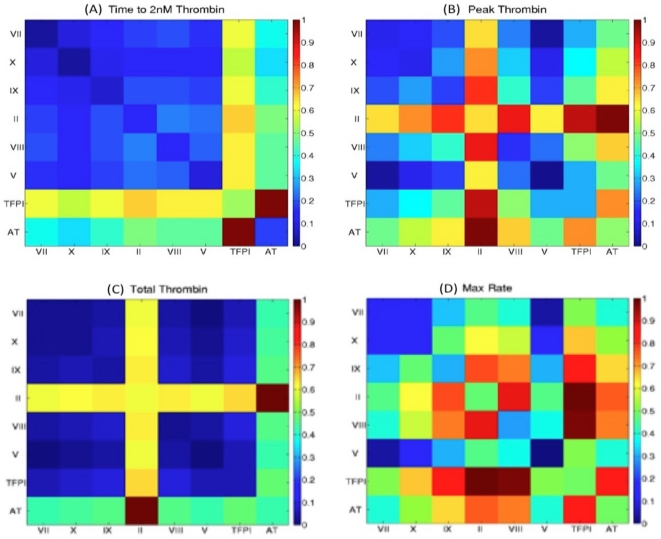
Figure 7. Factor pair induced variation in thrombin parameters.
Pairs of factors (28 possible) were varied through their normal range, thrombin parameters were extracted from resulting cTGPs, the factor pair induced ranges for each thrombin parameter established, and then the set of 28 ranges for each thrombin parameter expressed as a function of the largest induced range for that parameter. The color scale reflects the normalized range values. Each parameter box (64 normalized range values) shows the 28 factor pair effects (in duplicate) and the relative intensity of each single factor (8 total) contribution to variation in the indicated thrombin parameter (see reverse diagonal: bottom right to upper left).

