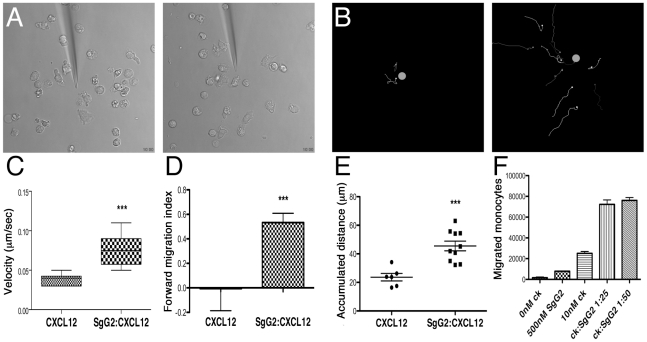
Figure 6. Analysis of SgG2 induced enhancement of chemotaxis by time-lapse video microscopy.
(A) Selected frames from Videos S1 and S2 showing migration towards CXCL12 (left) or CXCL12-SgG2 (right). (B) Migrating cells were tracked and their progressive trajectories were plotted according to the recorded xy coordinates. Orange dots indicate the real position of the micropipette dispensing CXCL12 (left) or CXCL12-SgG2 (right). Each line represents the path followed by one cell during 10 min at the initial phase of chemotaxis. (C) The velocity of cell movement, (D) forward migration index and (E) total traveled distance by cells migrating towards the micropipette dispensing CXCL12 or CXCL12-SgG2 were plotted. Representative data from 6 cells (CXCL12) and 10 cells (CXCL12-SgG2) migrating at the initial time period are shown. Time-lapse videos were analyzed using Image J 1.43 software. The trajectories of the tracks, velocities, FMI and distances traveled were calculated using Manual Tracking and Chemotaxis Tool version 1.01 plugging. The analysis of 1 representative video out of three is shown. (F) Representation of migrated monocytes in the presence of CXCL12 alone or in combination with SgG2 using the transwell technology. 1 representative experiment out of three is shown. Error bars indicate standard error values. *:P<0.05; **:P<0.01; ***:P<0.001.

