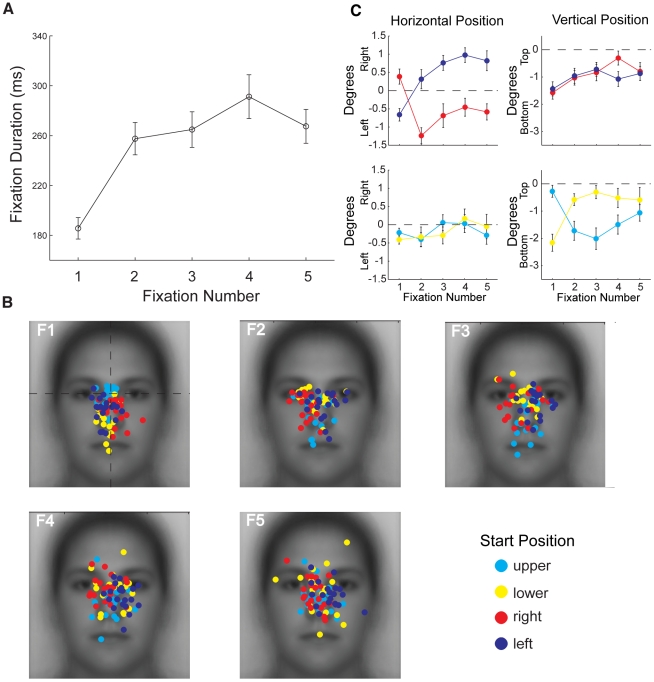
Figure 6. Evolution of fixations over ordinal number for upright faces.
(a) Average duration of each ordinal fixation. Note the much shorter duration of the first than subsequent fixations. (b) Distribution of individual participants' fixation locations broken down by start position for each ordinal fixation (F1–F5). Fixation locations for the first fixation were generally toward the center of the face, but with a relative tendency to fall closer to the start position. Fixation locations for subsequent fixations tended to fall on the side of the face opposite the start position. For example, on the first fixation, fixations for the left start position show a tendency to the left side of the face while those for the right start position show a tendency to the right side of the face. On subsequent fixations, these tendencies reverse with the right start position showing a tendency to the left side of the face and the left start position to the right side of the face. A similar effect can be observed for the upper and lower start positions. (c) Average locations from (b). The two left plots give the average horizontal position of fixations in degrees of visual angle relative to the midline of the face (dotted line). The two right plots give the average vertical position relative to the vertical position of the eyes (Figure 3b). Note the strong effect of the left and right start positions on horizontal but not vertical position (top panels) and the opposite effect for the upper and lower start positions (bottom panels). Error bars indicate the between-subjects standard error.

