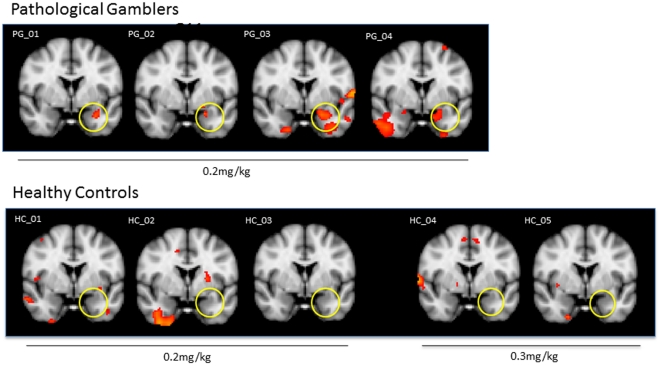
Figure 2. Individual data set.
Clusters of activation (colored; corrected p<0.001) from voxelwise analyses of the effects of yohimbine infusion obtained from individual subjects projected onto a background (grayscale) representing subjects' mean high-resolution anatomic image. Coordinates of coronal slices are in accordance with the Montreal Neurological Institute (MNI) space. Please note: two healthy controls received yohimbine at 0.3 mg/kg; the rest of the subjects were administered 0.2 mg/kg. PG-pathological gamblers; HC-healthy controls.

