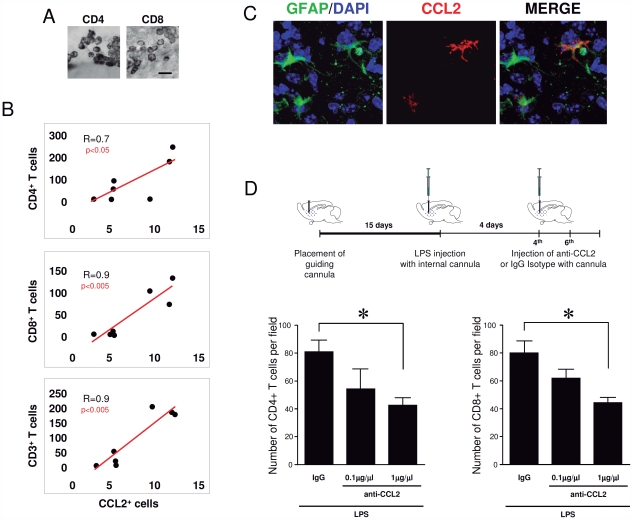
Figure 5. Intracerebral blocking of CCL2 attenuates the LPS-mediated T-cell infiltration.
(A) Detail of CD4+ and CD8+ T-cell immunostaining in the striatum of LPS injected mice. Scale bar: 20 µm. (B) The number of infiltrated T-cells (CD4+, CD8+ and CD3+ T-cells) correlates with the number of CCL2+ cells in the areas of LPS injection. (C) Intraparenchymal injection of anti-CCL2 antibodies attenuates the LPS-induced infiltration of lymphocytes in the mouse brain parenchyma. The diagram on the top shows the arrangement of the experiment. Graphs show the density of CD8 and CD4 T-cells in the brain parenchyma surrounding the injection site. (D) Astrocytes express CCL2 after LPS injection in mouse brain. Confocal images of the injected areas show the co-localization of GFAP+ astrocytes (green) and CCL2 (red) in mouse brain. DAPI (blue) was used as a nuclear counterstaing. * p<0.05 ANOVA-test.

