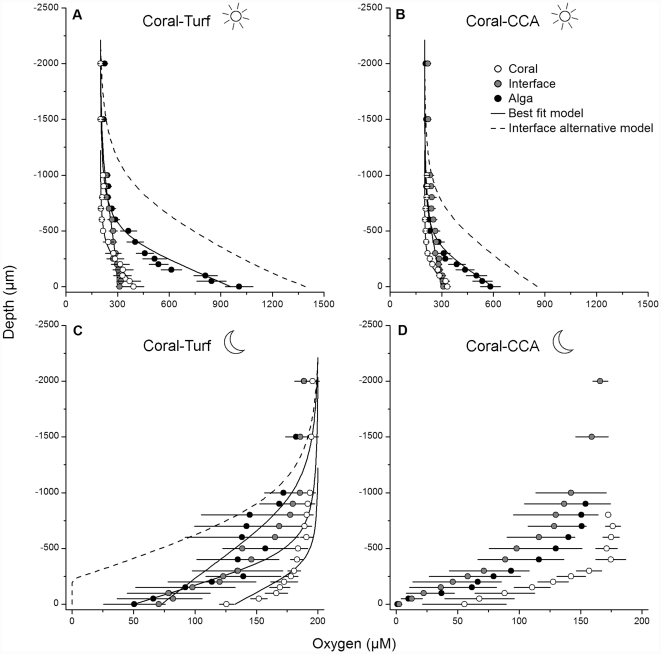
Figure 2. In situ oxygen microprofiles in coral-algal interactions during the day and night.
Data points are means ± SE. Depth 0 µm refers to the organism surface, and negative values indicate profiling upwards into the water column. Dotted lines show the oxygen distribution at the interface based on the initial assumption of a constant algal and coral flux. Solid lines illustrate the best fit model at each measuring spot (‘Coral’, ‘Interface’ and ‘Alga’). A) Porites-turf interactions during the day (n = 7 profiles), B) Porites-CCA interactions during the day (n = 9), C) Porites-turf interactions during the night (n = 3) and D) Porites-CCA interactions during the night (n = 3). Oxygen distribution could not be modeled for these measurements as the flux at the interface was mass transfer-limited.

