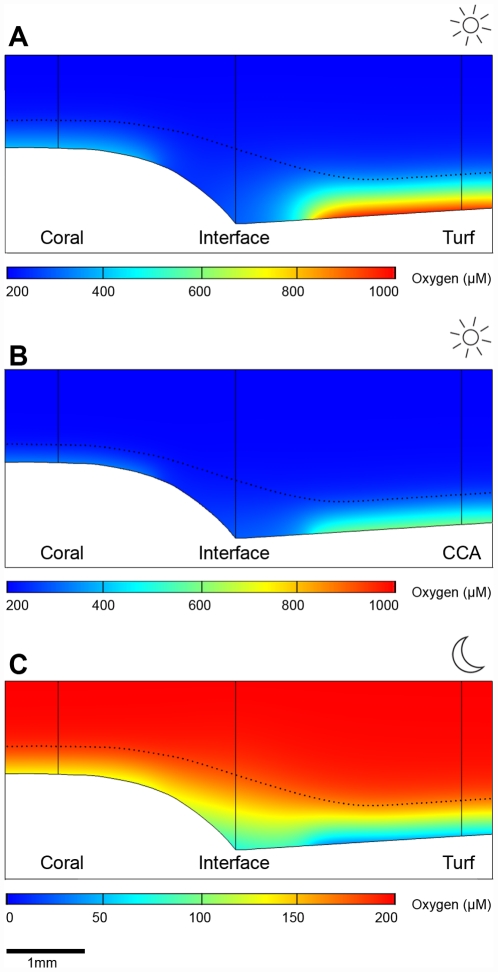
Figure 4. Best match scenarios of oxygen exchange dynamics between the massive coral Porites spp. and algae.
The two-dimensional oxygen distribution was modeled to best match the measured in situ oxygen microprofiles at the three measuring spots (‘Coral’, ‘Interface’ and ‘Turf/CCA’). Dotted black lines illustrate the thickness of the DBL. Sun and moon symbols represent day and night measurements, respectively. Note the different scales in oxygen concentration for the day and night. A) Day-time scenario for coral-turf, B) Day-time scenario for coral-CCA, C) Night-time scenario for coral-turf.

