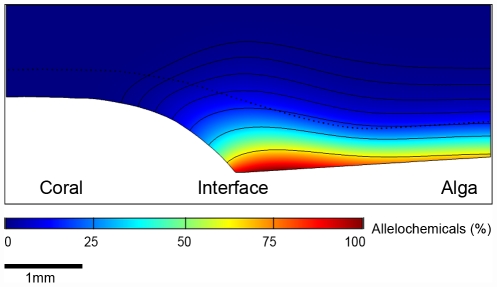
Figure 5. Transport of algal allelochemicals at the coral-algal interface.
The figure shows the modeled steady state distribution of a low molecular weight substance released by the algae. The lowermost isoline illustrates 64% of the total concentration of the substance. Subsequent isolines represent a halving of the effect. The dotted black line illustrates the thickness of the DBL, based on measurements in coral-turf interactions. The impact of the alga extends to ∼1 mm over the coral.

