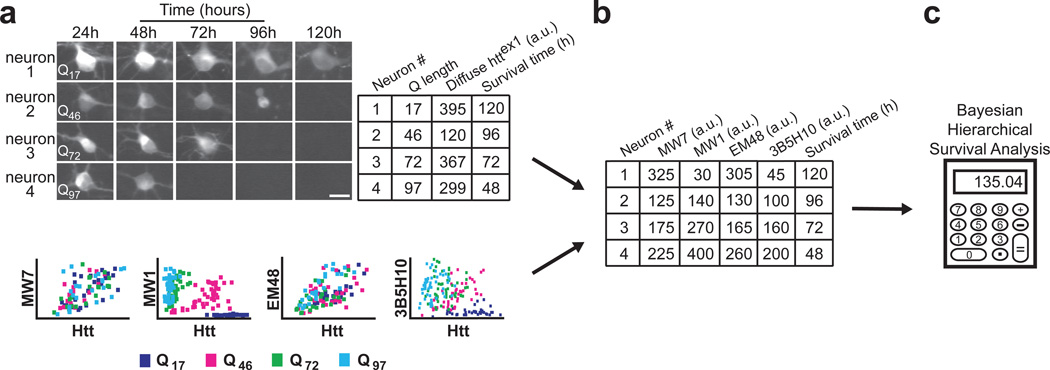
Figure 3.
Novel methodology distinguishes which of several simultaneously existing in situ epitopes of diffuse httex1 best predicts neurotoxicity. (a) The survival of individual neurons and the levels of diffuse Httex1-(Q17,Q46,Q72, or Q97)-eGFP they contained were determined by automated microscopy and recorded in a spreadsheet. Next, we used the regression coefficients from Figure 2 to relate diffuse Httex1-Qn-eGFP levels to antibody binding values (bottom; copied from Figure 2a). To account for the inaccuracy inherent in estimating antibody binding values from the graphs at bottom, we technically calculated regression coefficients using Bayesian methods (Fig. 2b, Supplementary Fig. 5 online). Scale bar=25 µm. (b) Using the regression coefficients from the plots in Figure 2, we can estimate how much antibody staining would have occurred in each neuron. These antibody staining values are then noted in the spreadsheet. (c) Finally, using each neuron’s estimated amount of antibody staining and its survival time, we compared the epitopes with each other using Bayesian hierarchical survival (Cox) analysis, which determines the antibody that best predicts degeneration. Hierarchical Bayesian methods ensure that “estimation errors” from each step of the analysis propagate through to the final readout. A more detailed schematic of our approach is illustrated in Supplementary Figure 6 online and detailed in Supplementary Methods online.

