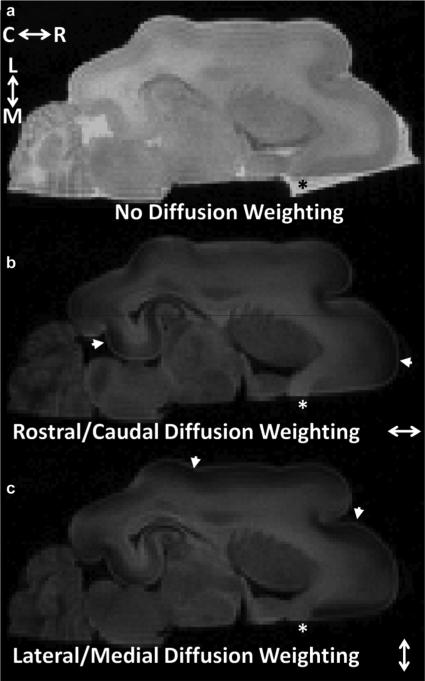
Fig. 1.
Data used to measure water diffusion in cerebral cortex of a P13 brain. All panels are shown on a common intensity scale. The b-value for the axial image in (a) was 0, and for (b) and (c) was 2.5 ms/μm2. The diffusion-sensitizing gradients were approximately parallel to the brain rostral/caudal axis in (b) and lateral/medial axis in (c). Due to the larger water diffusion coefficient in aqueous solution than in tissue, image intensity for phosphate-buffered saline surrounding the brain that was not displaced by perfluorinated media is observable in the absence of diffusion weighting [(a) black asterisk], but is dramatically attenuated in images in which b = 2.5 ms/μm2 [white asterisks in (b), (c)]. Water diffusion anisotropy in the cerebral cortex is manifest in reduced signal intensity for regions in (b), (c) in which neuronal processes are parallel to the applied diffusion-sensitization gradients (arrowheads). Abbreviations—C: caudal; L: lateral; M: medial; R: rostral.

