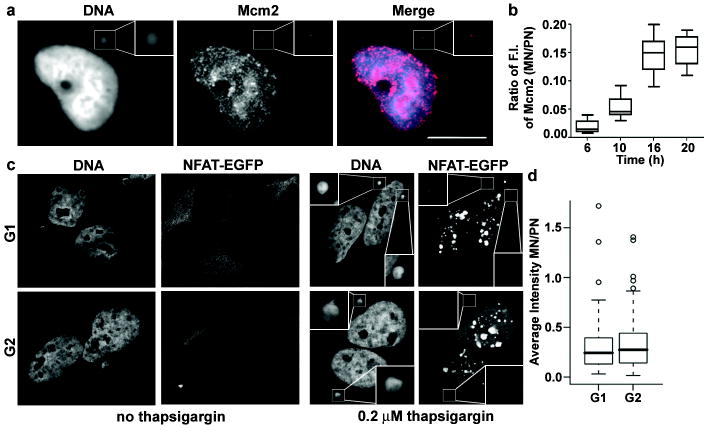
Figure 4. Defective MCM2-7 complex recruitment, DNA damage response and nucleocytoplasmic transport in MN.
a, Impaired Mcm2 recruitment into MN. G1 RPE-1 cells were synchronized as in Fig. 1a and stained for chromatin-bound Mcm2 and DNA. Scale bar, 10 μM. b, Relative Mcm2 fluorescence intensity (F.I.) as in Fig. 3e. Approximate cell cycle stage of timepoints: 6h, G1; 10h, early S-phase; 16h, mid-S phase and 20h, late S-phase. (2 experiments, n=50). c,d, Micronuclei are partially defective for nuclear import of NFATc1-EGFP. c, Representative images of micronucleated U2OS cells stably expressing NFATc1-EGFP in G1 and G2 with or without treatment with 0.2 μM thapsigargin for 10 min. d, Ratio of NFATc1-EGFP fluorescence intensity between MN and primary nuclei. (3 experiments, n=30).

