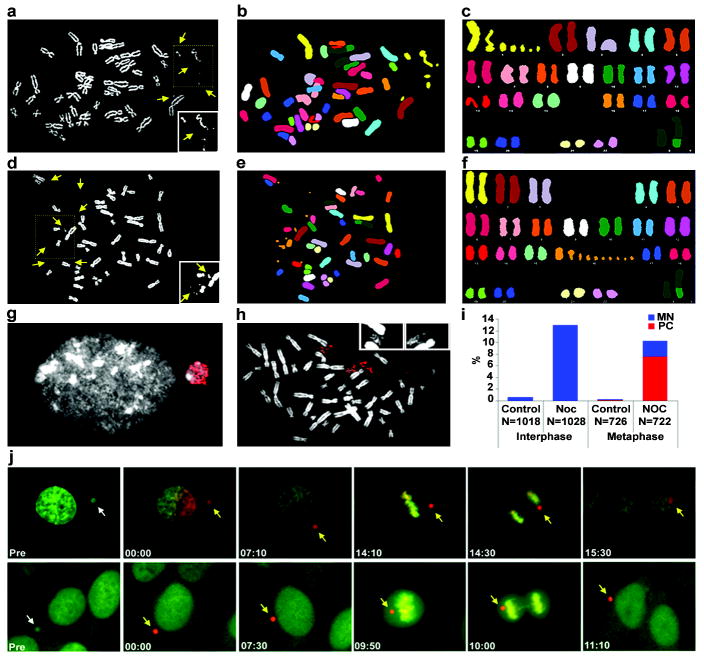
Figure 5. The fate of chromosomes in micronuclei.
MN were induced in RPE-1 cells as described in Fig. 1a (after p53 knockdown) and chromosome spreads were prepared 24 h after nocodazole release. a-c, Pulverization of chromosome 1 demonstrated by (a) DAPI staining (chromosome fragments, brightened in inset, yellow arrrows), (b) SKY probes (pseudo-colored), and (c) aligned SKY karyotype. d-f, Pulverization of chromosome 16, viewed as in (a-c). g, A BrdU positive MN-containing G2 RPE-1 cell. 2 h BrdU pulse label, DNA: white, BrdU: red. h, Selective BrdU labelling of a pulverized chromosome. i, The percentage of cells with intact MN (blue bars) or pulverized chromosomes, PC (red bars) from control or nocodazole-released (NOC) RPE-1 cells. Interphase is 18 h sample and metaphase is 24 h. j, Images from live-cell experiment showing a pre-converted green-fluorescent MN (white arrows) photo-converted to a red-fluorescent MN (yellow arrows) imaged through mitosis. Following anaphase, MN either reincorporated with the primary nucleus or failed to reincorporate and reformed as MN top row: reincorporation of MN into primary nucleus; bottom row: no reincorporation. Time shown is hr:min.

